The 2011 Area Classification for Output Areas, or 2011 OAC, is a geodemographic classification that was developed by Dr Chris Gale during his Ph.D at UCL Geography over the last few years, in close conjunction with the Office for National Statistics, who have endorsed it and adopted it as their official classification and who collected and provided the data behind the classification – namely the 2011 Census.
A geodemographic classification such as this takes the datasets and looks for clusters, where particular places have similar characteristics across many of the variables. It does this on a non-geographic basis, but spatial autocorrelation means that geographic groupings do typically appear – e.g. a particular part of an inner city will typically have more in common with another part of the inner city, than of the suburbs. However, these areas will often also share much in common with other “inner city” parts of cities elsewhere. Names are then assigned, to attempt to succinctly describe the clusters.
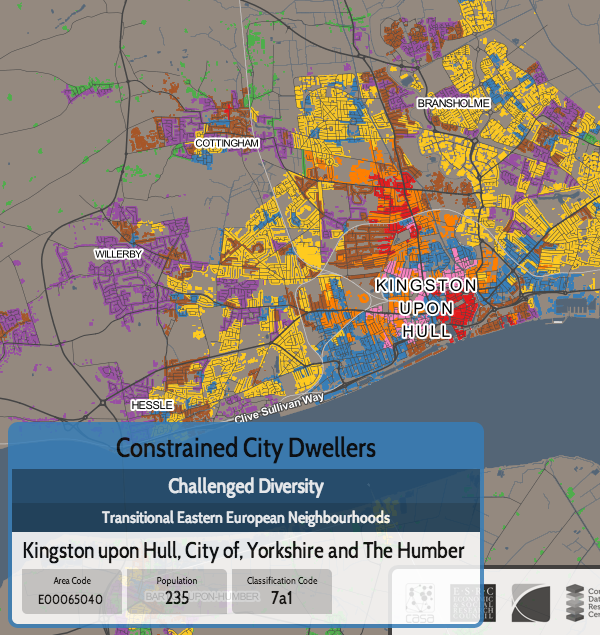
As part of the DataShine project, we have taken the classifications, and mapped them, using the DataShine style of restricting the classification colouring to built up areas and (when zoomed in) individual rows of houses. The map is the third DataShine output, following maps of individual census tables and also the new Travel to Work Flows table.
We’re just mapping the eight “Supergroups”, the top-level clusters. A pop-up shows the more detailed groups and subgroups, and you can find pen-portraits for all these classifications on the ONS website.
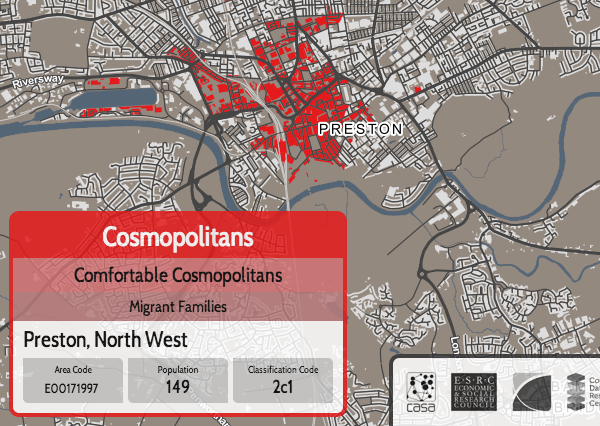
Click on the box for an individual supergroup, in the key at the top, to see a map showing just that supergroup on its own. For example, here are the “Cosmopolitan” dwellers of London:
Like 2011 OAC itself, the map covers all of the UK, including Scotland and Northern Ireland. For the latter, there is no Ordnance Survey Open Data which is how I created the building/urban outlines, so I have improvised with data from OpenStreetMap and NISRA (Northern Ireland Statistics).
The map is part of DataShine, an output of the BODMAS project, but also is in conjunction with the the new Consumer Research Data Centre, an ESRC Data Investment which is being set up here at UCL and other institutions. As such, there is a CDRC version of the map.
As part of the BODMAS project we have also been studying the quality of fit of 2011 OAC for different parts of the UK, and techniques to visualise the uncertainty and quality of the classifications. We will be presenting these findings at the Uncertainty workshop at the GIScience conference in Vienna, later this month.