We’ve made three changes to the DataShine Commute websites:
- For DataShine Scotland Commute we have made use of a new table, WU03BSC_IZ2011_Scotland, published recently on the Scotland’s Census website, which breaks out small-area journeys by mode of transport, in the same way that the England/Wales data does.
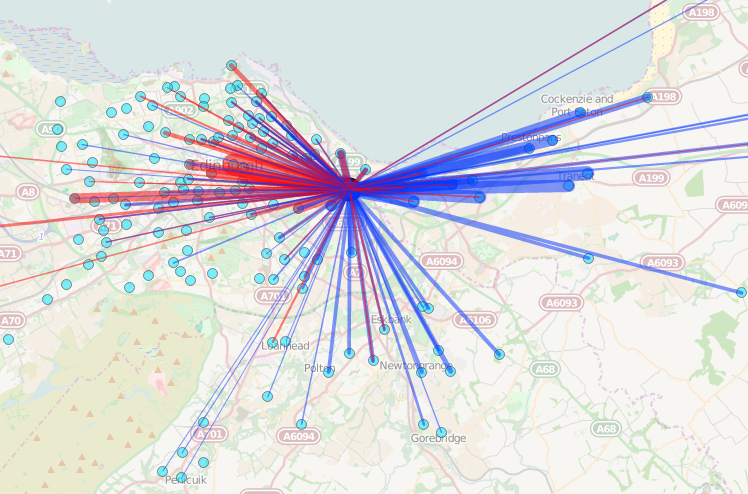
The small-area geography used, Intermediate Geography “IG”, is broadly equivalent to the MSOAs used in England/Wales although the average population is half the size, so we show the lines twice as thickly. There is some additional grouping in the Scotland data – metro services (i.e. Glasgow’s Clockwork Orange) are combined with rail, and commutes by taxi and motorbike are moved into “Other”.Looking at the data reveals some characteristic patterns which might be expected, for example, on the edge of Edinburgh, the commute to that point is from outside of the city, and from that point to closer in to the city centre. This effect is strongly also seen around London.
- For DataShine Commute (England/Wales) we now include numbers, in the summary table for each area, for commuters living in that area who work in Scotland, in Northern Ireland, outside the UK, at home, in no fixed location or on offshore installations.
These numbers, along with those for people who work elsewhere within the area, are shown in grey in the table. None of these seven special categories are shown as lines on the map. - Finally, we have expanded and renamed, to DataShine Region Commute, the previous map of commuting flows in Scotland which we introduced last month alongside DataShine Scotland. The previous map was at a coarse level (showing only flows between local authorities) and was intended to be a stop-gap until the above more granular data was released. Rather than removing this website, we have decided to expand it to include the data from England, Wales and Northern Ireland too, and show flows between these places as well. This was generally straightforward to do as the Office for National Statistics published a UK-wide table at local-authority level. Constructing the Northern Ireland part of the map was less trivial as the local authority boundary files there are not straightforward to obtain, and needed to be derived.For visual clarity, we have colour coded the different nations within the UK.
We have also taken the opportunity to upgrade almost all the DataShine websites (see list on the left!) to use OpenLayers 3.8.2, the most recent release of the rapidly evolving mapping library. The new version has a lot of changes, which we’ve tried to work with (such as ol.format.TopoJSON() and ol.View.fit()) but may have missed something, so if you see any new bugs on a DataShine website let us know in the comments.