DataShine Census has two new features – local area rescaling and data download. The features were launched at the UK Data Service‘s Census Research User Conference, last week at the Royal Statistical Society.
Local Area Rescaling
This helps draw out demographic versions in the current view. You may be in a region where a particular demographic has very low (or high) values compared to the national average, but because the colour breakout is based on the national average, local variation may not be shown clearly. Clicking on the “Rescale for current view” button on the key, will recolour for the current view.
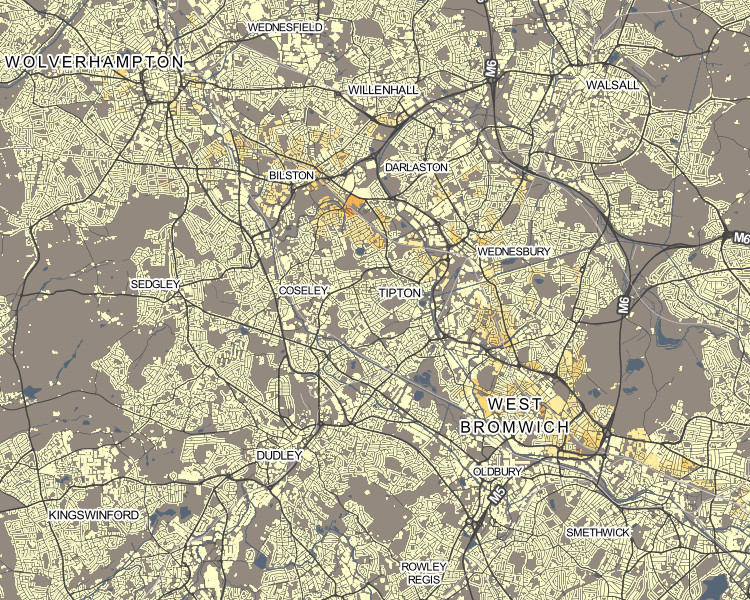
For example, the popularity of London’s underground network with its large population, means that, for other cities with metros or trams, their usage is harder to pick out. So, in Birmingham, the Midland Metro can be hard to spot (interactive version):

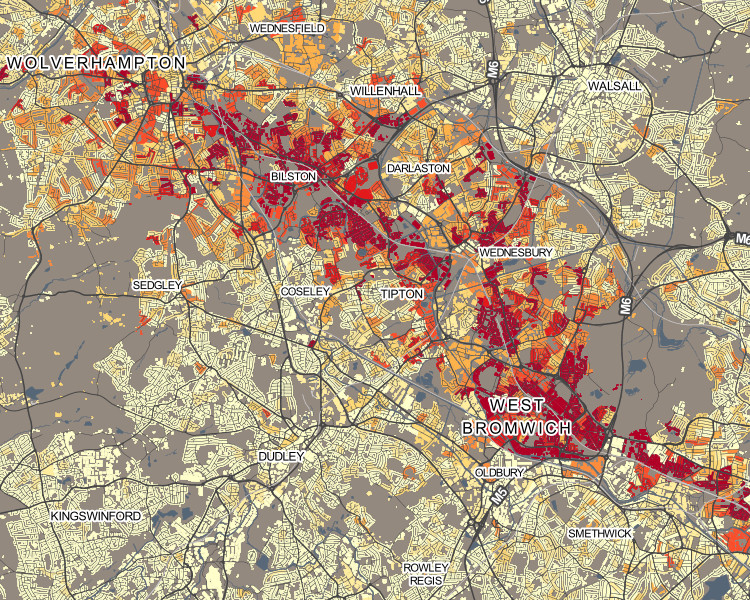
Upon rescaling, just the local results are used when calculating the average and standard deviation, allowing usage variations along the line to be more clearly seen:

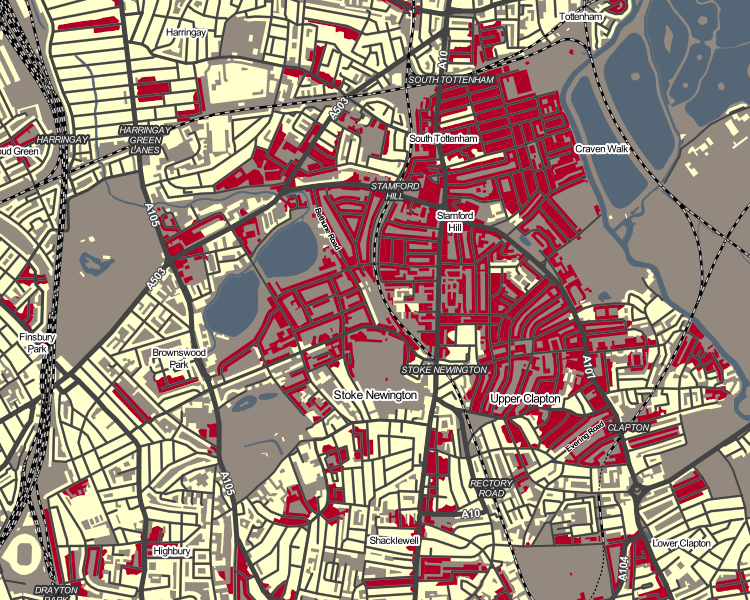
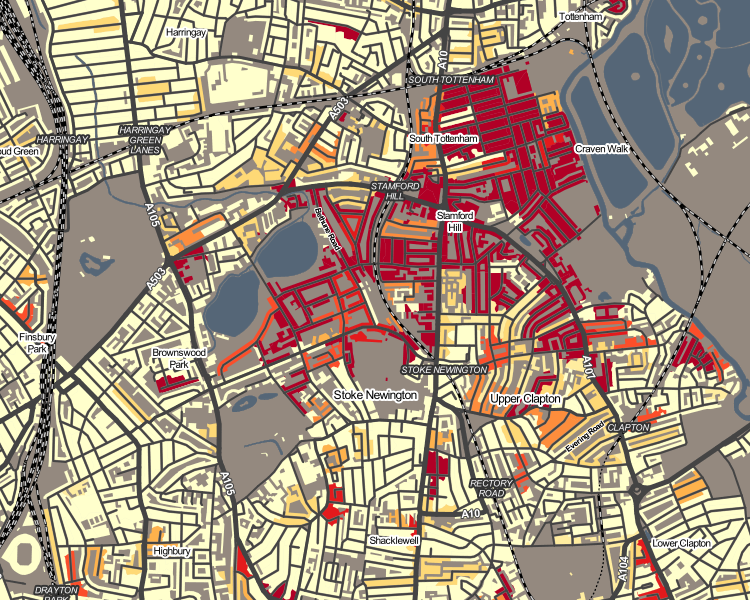
As another example, rescaling can help “smooth” the colours for measures which have a nationally very small count, but locally high numbers – it can remove the “speckle” effect caused by single counts, and help focus on genuinely high values within a small area.
Hebrew speakers in Stamford Hill, north-east London (interactive version):

Upon rescaling, a truer indication of the shape of the core Hebrew-speaking community there can be seen:

Occasionally, the local average/standard deviation values will mean that the colour breakout (or “binning”) adopts a different strategy. This may actually make the local view worse, not better – so click “Reset” to restore the normal colour breakout. Planning/zooming the map will retain the current colour breakout. PDFs created of the current view also include the rescaled colours.
Data Download
On clicking the new “Data” button on the bottom toolbar, you can now download a CSV file containing the census data used in the current view. Like the local area rescaling functionality, this data download includes all output areas (or wards, if zoomed out) in your current view. This file includes geography codes, so can be combined with the relevant geographical shapefiles to recreate views in GIS software such as QGIS.
Next on the DataShine project, we are looking to integrate further datasets – either aggregating certain census ones or including non-census ones such as IMD and IDACI deprivation measures, or pollution.