This post is cross-posted from oobrien.com.
OpenLayers is a powerful web mapping API that DataShine uses to display full-page “slippy” maps. DataShine: Census has recently been upgraded to use OpenLayers 3. Previously it was powered by OpenLayers 2, so it doesn’t sound like a major change, but OL3 is a major rewrite and as such it was quite an effort to migrate to it. In due course, we plan to migrate the other DataShine websites to OpenLayers 3 too, although each website is quite different under the covers so will prove a challenege too.
Here are some new features, now in DataShine, which are made possible by the move to OpenLayers 3.
Drag-and-drop shapes
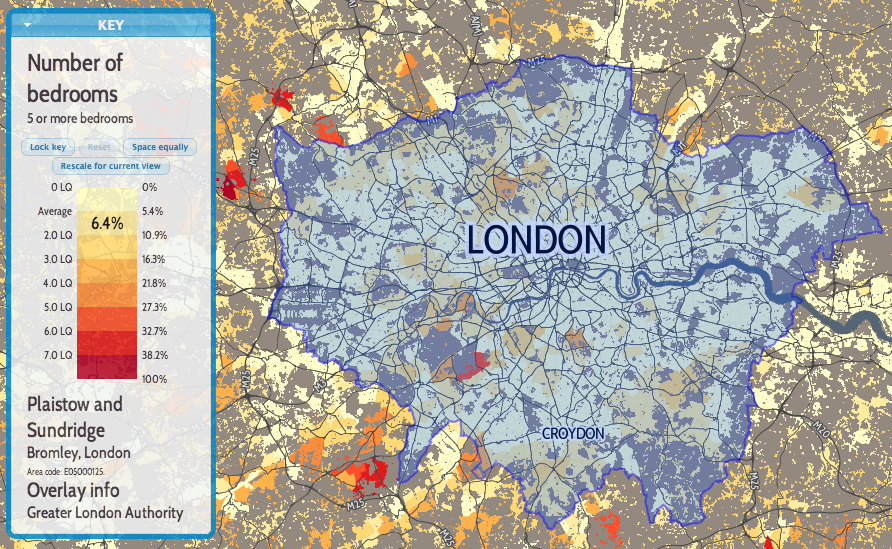
One of the nicest new features of OL3 is drag-and-dropping of KMLs, GeoJSONs and other geo-data files onto the map (simple example). This adds the features pans and zooms the map to the appropriate area. This is likely most useful for showing political/administrative boundaries, allowing for easier visual comparisons. For example, download and drag this file onto DataShine to see the GLA boundary appear. New buttons at the bottom allow for removal or opacity variation of the overlay files. If the added features include a “name” tag this appears on the key on the left, as you “mouse over” them. I modified the simple example to keep track of files added in this way, in an ol.layer.Group, initially empty when added to the map during initialisation. Note: The file you drag on should be in WGS84 lat/lon format (aka EPSG:4326) or WebMercator (aka ESPG:900913 or EPSG:3857). It will not work with the British National Grid projection (aka EPSG:27700).
Nice printing
Another key feature of OL3 that I was keen to make use of is much better looking printing of the map. With the updated library, this required only a few tweaks to CSS. Choosing the “background colours” option when printing is recommended. Printing also hides a couple of the panels you see on the website.
Better looking controls and smoother zooming
OL3 also has much smoother zooming, and nicer looking controls. Try moving the slider on the bottom right up and down, to see the smooth zooming effect. The scale control also changes smoothly. Finally, data attributes and credits are now contained in an expandable control on the bottom left.
A bonus update, unrelated to OL3, is that I’ve recreated the placename labels with the same font as the DataShine UI, Cabin Condensed. The previous font I was using was a bit ugly.
For notes on UTF Grids and Permalinks, both of which required a lot of work to reimplement so that DataShine with OL3 behaves like the version with OL2, see the developer blog post.

Above: GeoJSON-format datafiles for tube lines and stations (both in blue), added onto a DataShine map of commuters (% by tube) in south London.