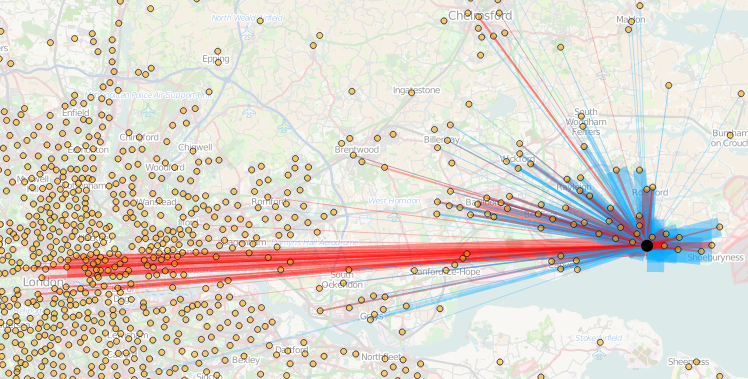
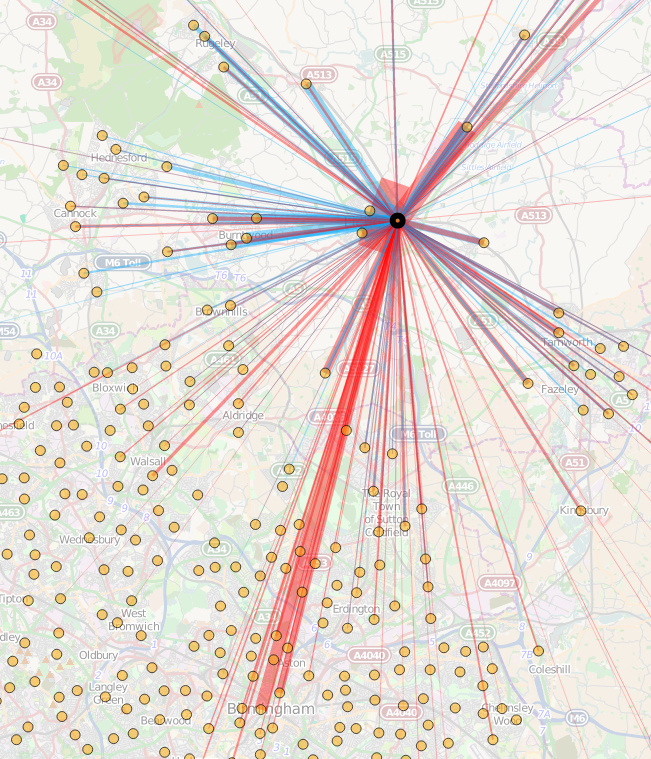
Today, the Office for National Statistics (ONS) have released the Travel to Work Flows based on the 2011 census. These are a giant origin-destination matrix of where people commute to work. There are various tables that have been released. I’ve chosen the Method of Travel to Work and visualised the flows, for England and Wales, on this interactive map. The map uses OpenLayers, with an OpenStreetMap background for context. Because we are showing the flows and places (MSOA population-weighted centroids) as vectors, a reasonably powerful computer with a large screen and a modern web browser is needed to view the map. The latest versions of Firefox, Safari or Chrome should be OK. Your mobile phone will likely not be so happy.
Blue lines represent flows coming in to a selected place, that people work in. Red lines show flows out from the selected location, to work elsewhere.
The map is part of the DataShine platform, an output of the BODMAS project led by Dr Cheshire, where we take big, open datasets and analyse them. The data – both the travel to work flows and the population-weighted MSOA centroids – come from from the ONS, table WU03EW.
View the interactive map here.
Hello, I created a map very similar to my Milan metropolitan area, I’d have some comparison, thanks. My map here: http://goo.gl/VFIe0t
Very useful tool for seeing current cycling and walking trips to work.
Would it be possible to label each point by the code in the table e.g. Middlesbrough 001, 019, o11 etc so its easy to work out which line is which
Great piece of kit – the ONS district level interactive map is really useful, but the ward level data is invaluable, particularly as we’re interested in travel inside the district. Being able to let colleagues use the map to illustrate points as we discuss them, rather than pull up tables of data is a huge benefit
Thanks for adding the reference to the source table which is really helpful. Your tool is proving very helpful for informal browsing of this data.
Could I also ask whether the dataset used remains the 25th July release? ONS re-released the data in August following some corrections. I understand these are quite minor but it’s useful to be aware. (I’m sure you didn’t intend to make updating this an ongoing job, but if that’s the case then it’s useful to flag that).
Disappointingly, ONS aren’t making the update obvious. The ‘last update’ field on pages such as this https://www.nomisweb.co.uk/census/2011/wu03ew is still 25th July, but if you click through to download the data there’s a message informing of the update.
Thanks again for a useful tool.
Tim – Thanks for letting me know that. I’m not planning on pulling in minor updates but will keep an eye on the Issues and Corrections page. Also, I’ll add a small note to the page, referencing the file date used.